Alright, buckle up, folks! Let me tell you ’bout my deep dive into the 2022 Canadian Grand Prix. It was a wild ride, and I’m spillin’ all the details.
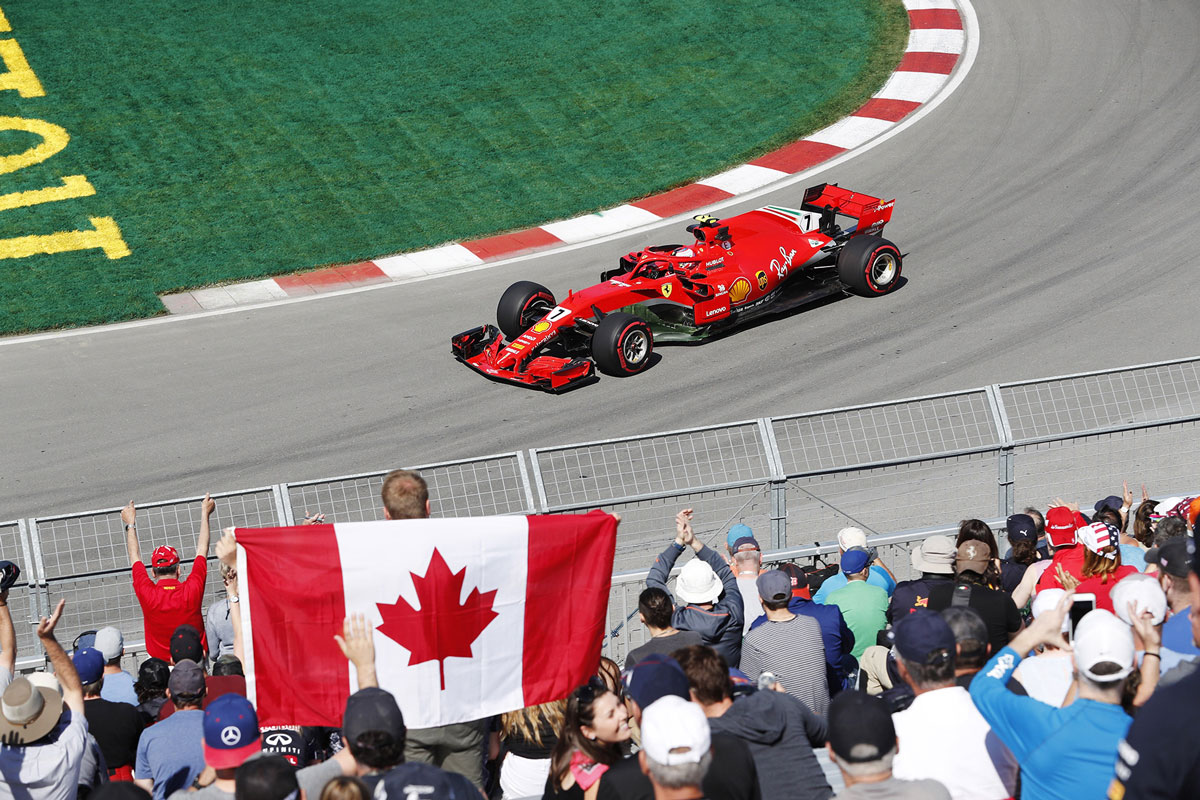
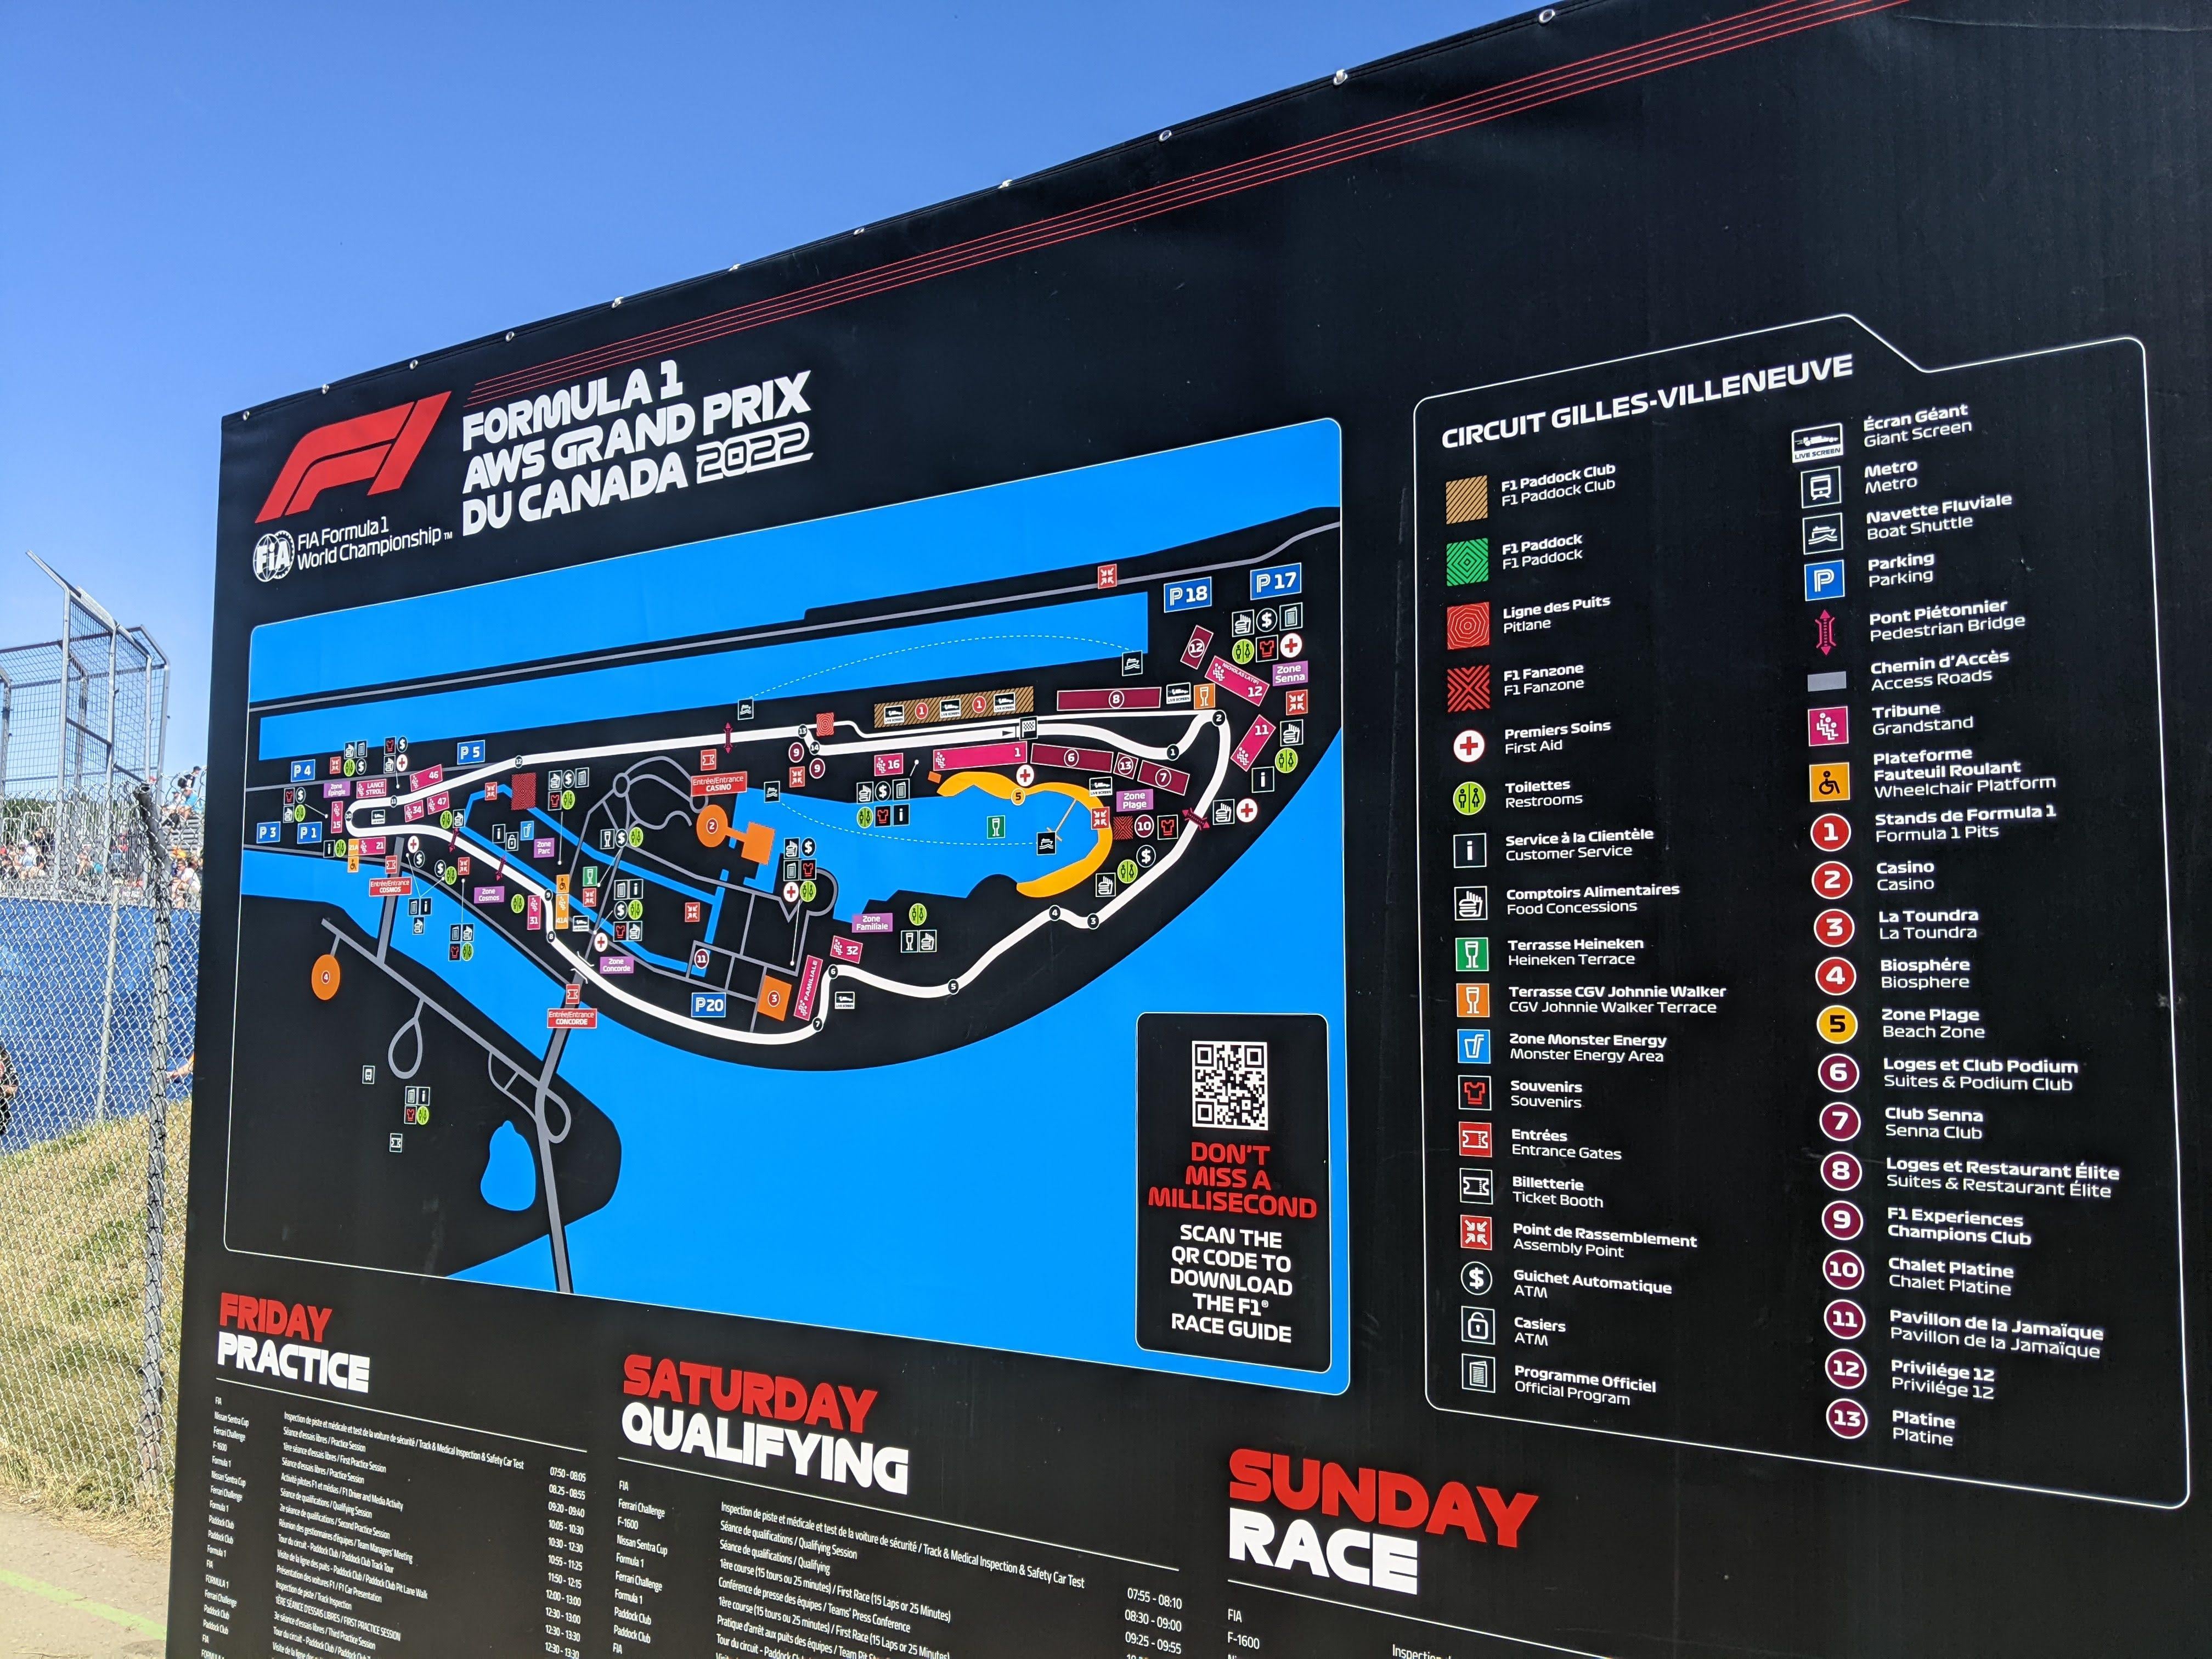
First off, why the Canadian GP? I’m a motorsport nut, simple as that. And the Circuit Gilles Villeneuve? Legendary. So, I decided I was gonna analyze the heck out of it.
I started by grabbing all the data I could find. Lap times, weather conditions, tire strategies – the whole shebang. Websites, forums, even some shady corners of the internet. You name it, I scraped it. Data is king, ya know?
Then came the fun part: cleaning up that mess. Seriously, data from different sources? Total chaos. I used Python, mostly with Pandas, to wrangle it all into something usable. Lots of “dropna()” and “fillna()” action, lemme tell ya.
Once the data was clean, I started plotting things. Lap times over the race, comparing drivers, seeing how tire choices affected performance. Matplotlib and Seaborn were my best friends. Found some cool trends, like how Verstappen was managing his tires like a pro.
Next up, digging into the strategy. I built a simple model to predict the optimal pit stop times, based on tire degradation and track position. Turns out, Ferrari’s strategy for Leclerc was… questionable, to say the least. No surprise there, eh?
I even tried to predict the race outcome using a Monte Carlo simulation. Threw in some random factors like safety cars and mechanical failures. Gave Verstappen a slight edge, which, looking back, was pretty spot on.
What did I learn? Besides that I need to brush up on my statistical modeling? A ton! Little things, like how important track temperature is at that circuit. And bigger things, like how crucial it is to have a reliable car. Ferrari learned that the hard way.
Was it perfect? Nah. My simulation wasn’t exactly Nostradamus. But it was a blast to build, and I learned a ton in the process. Plus, I got to nerd out about Formula 1. Win-win!
Would I do it again? Absolutely! Maybe next time I’ll try adding more variables to my model, like driver skill and car performance. The possibilities are endless!
- Data Acquisition
- Data Cleaning (Python + Pandas)
- Data Visualization (Matplotlib, Seaborn)
- Strategy Modeling
- Monte Carlo Simulation
So, that’s the story of my 2022 Canadian GP adventure. Hope you found it interesting! Now, if you’ll excuse me, I’m off to start planning my next motorsport data project…